ICT and the Weather
Using ICT to help with data collection, data storage, data manipulation and data sharing has become much more practical. Many of the tools used are both easily available and affordable. Other devices are more expensive, but they can take many more types of reading, and are often wireless. Digital recording can help to collect weather data without the meteorologist even being there! This means that they can make the life of the meteorologist much easier.
This page describes just a few of the many examples of how ICT can help with monitoring the weather. To see more examples you can go to More About ICT and the Weather.
When you have finished reading about this you may want to return to Collecting Data.
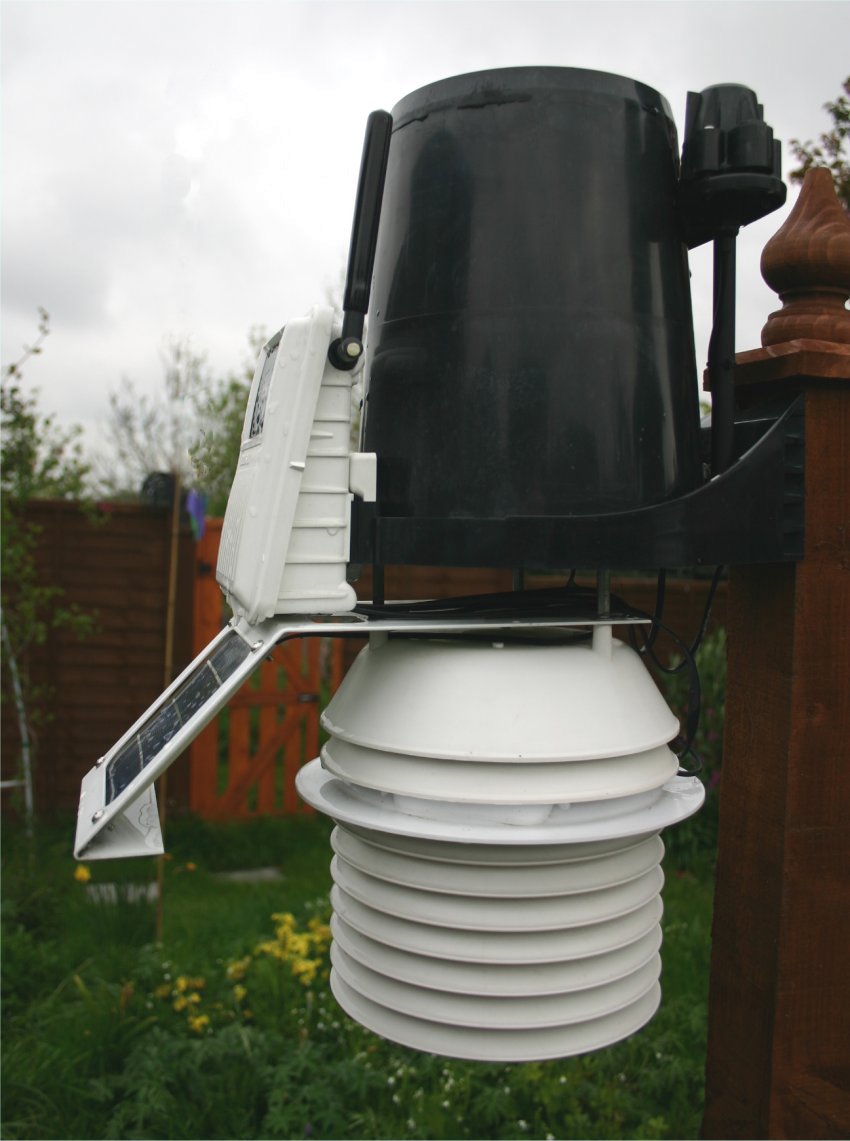
Remote ReadingsThis example is a Davis VantagePro2 weather station. It is solar powered and sends its data by radio signal. The large back container has a tipping bucket rain gauge in it. The louvred white section contains the thermometers. The little black domes, one of which can be seen on the right, collect data about sunlight. The unit comes with its own software which can save, share and graph the data. See more about this apparatus (including the display console and anemometer) on More About ICT and the Weather. |
|
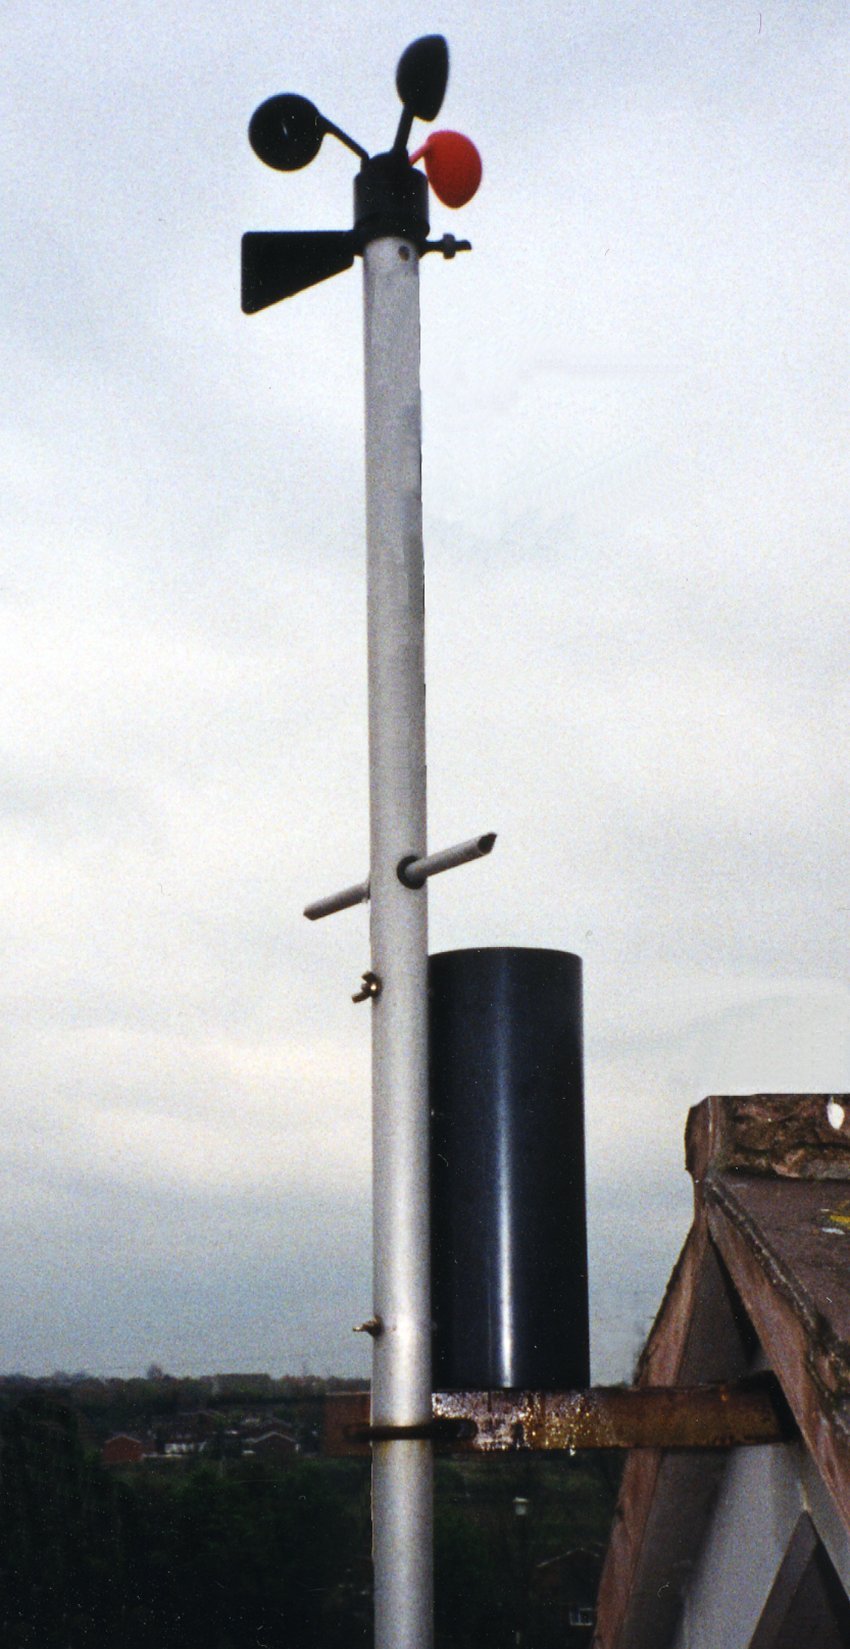
Remote ReadingsThis weather station is a Weather
Reporter. It is mounted high up on the roof apex. The cups at the top measure the wind
speed. The sail just below them monitors the wind direction.
The black unit has the rain gauge inside it. It measures the
drops of rain with a tipping bucket mechanism. It then calculates
rainfall in millimetres. Just above the rain gauge is a silver
coloured cross-piece which contains the thermometer and a light
sensor to record sunlight hours. |
|
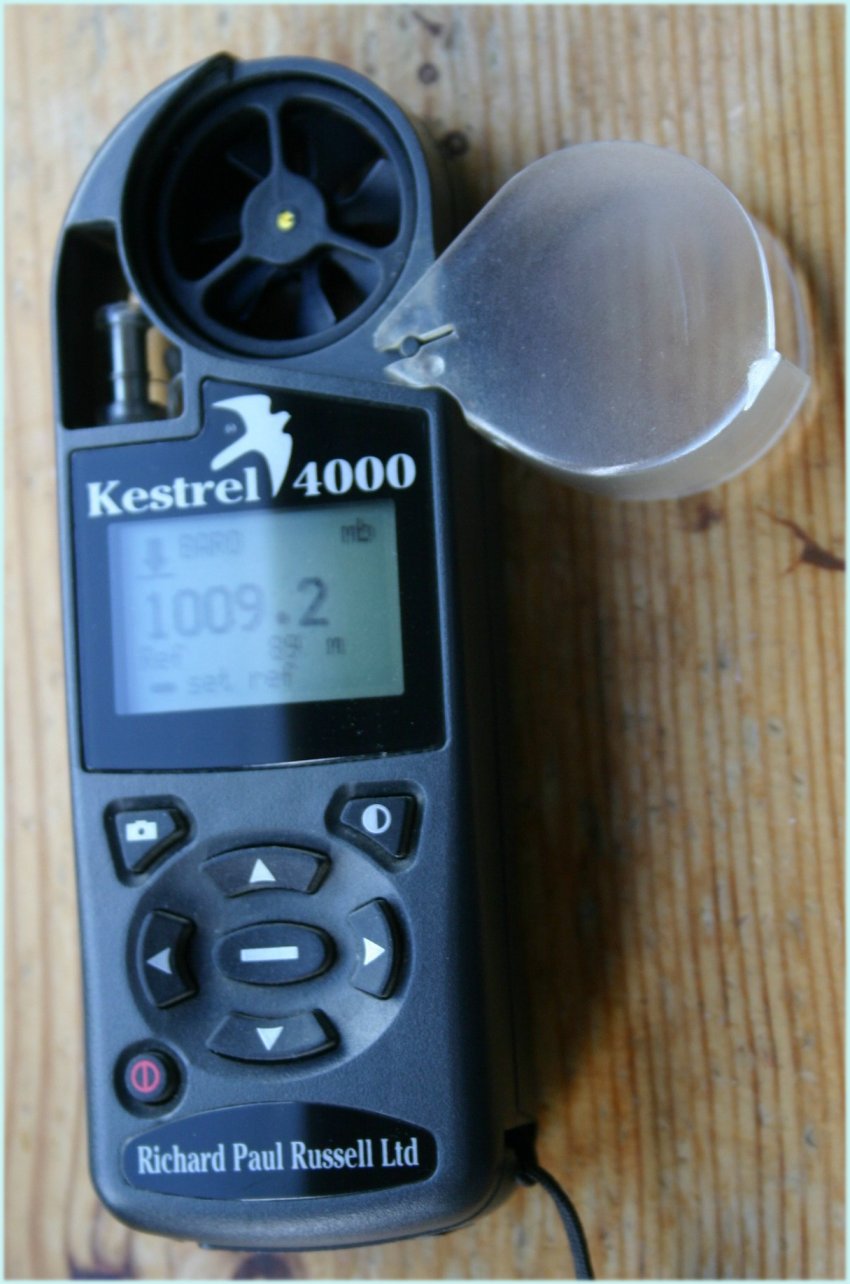
Portable SensingThis is one example of the type of portable sensing devices that can be used to take weather readings. This one is used by people for a variety of sports including sailing. It can take many readings including air pressure and wind speed. This example, the Kestrel 4000, can download its data to a computer, where it can be saved and graphed. This is done using a special 'cradle' unit. These can be used to take accurate readings when out on field trips. Many cheaper versions, with less readings but good for measuring the wind) are now available. |
 |
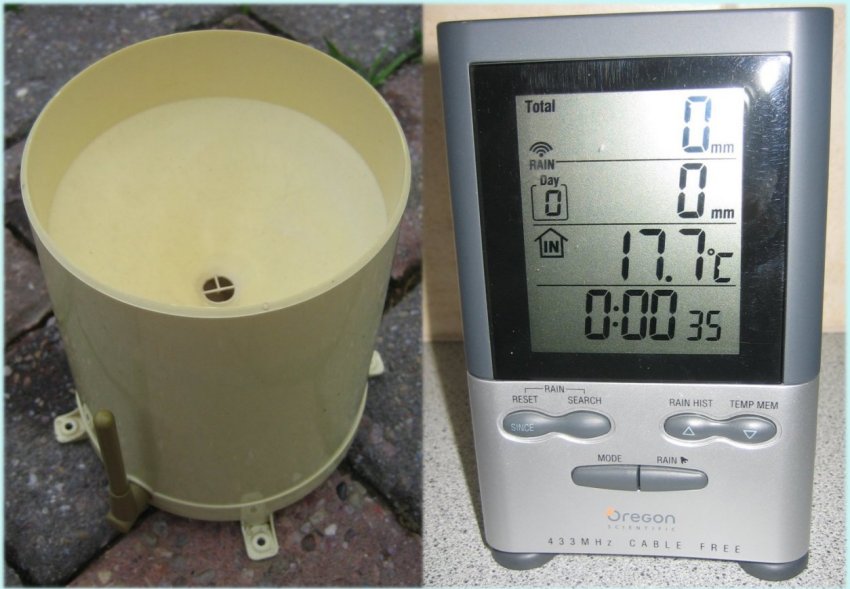
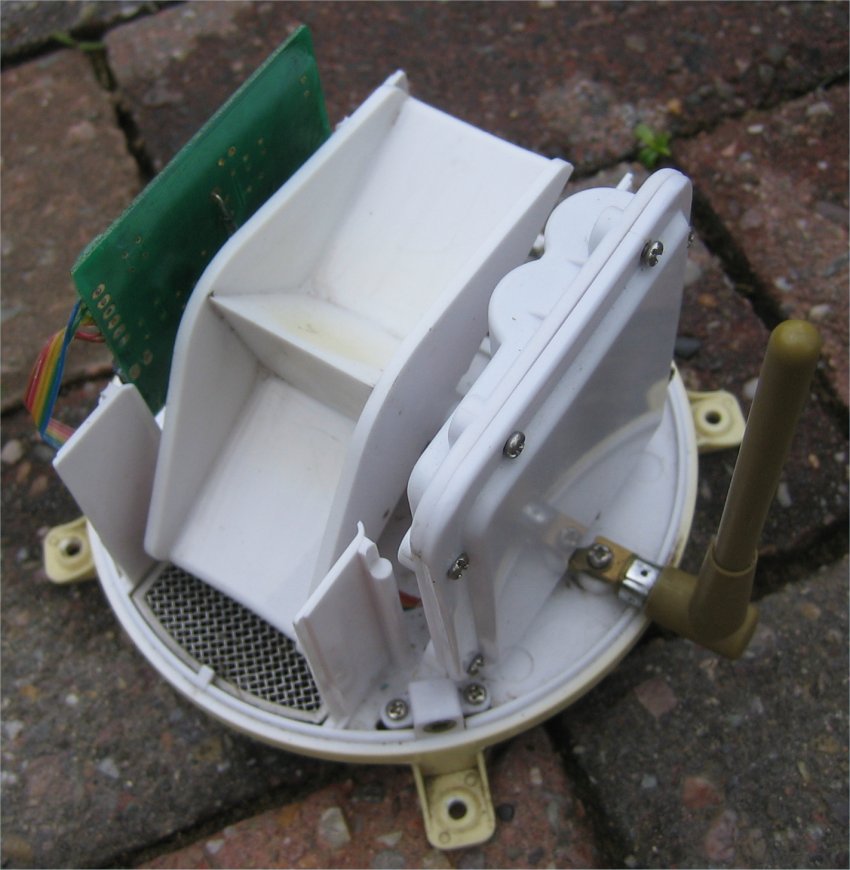
Digital Rainfall MonitoringIt is useful to be able to collect rain data digitally. This unit collects data using a tipping bucket. This can be seen in the lower photograph where the cover has been removed. When the first bucket has a set amount of rain in it it tips up and empties itself. The other bucket is then filled and the process repeated. The receiver can be placed inside where it can be easily read. The outside unit transmits a signal to the display unit inside. |
|
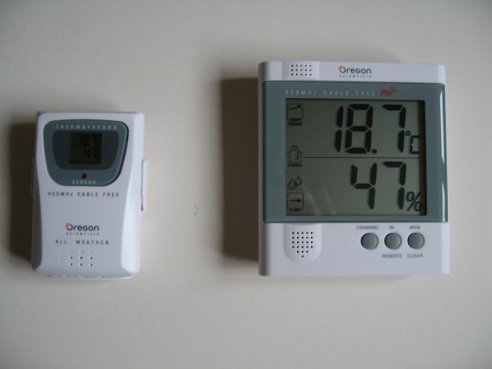
Digital Temperature SensingIt is fairly cheap and easy to set up a remote monitor to record temperature readings. This example can record data from several locations. It does not need wires joining the different sensors to the control unit. It sends a radio signal with the readings from the sensor to the display unit. It can record maximum, minimum and current temperatures. After taking readings the unit is reset to start recording the new maximum and minimum. This example also records humidity. See a cheaper a wired temperature sensing example below or on the on the temperature page. |
 |
Digital ThermometerThis fairly reasonably priced wired thermometer can record two sets of data. One is recorded by a sensor in the unit, the other via a sensor on the end of a cable. These different readings are shown one above the other on the display. The video shows how the display can show the current, maximum and minimum temperatures. Different makes of thermometers reset these readings in different ways. They would be reset after the temperatures had been recorded on a paper sheet. If you want to make a mini weather station the instructions are on the Teacher Resource Exchange. |
|
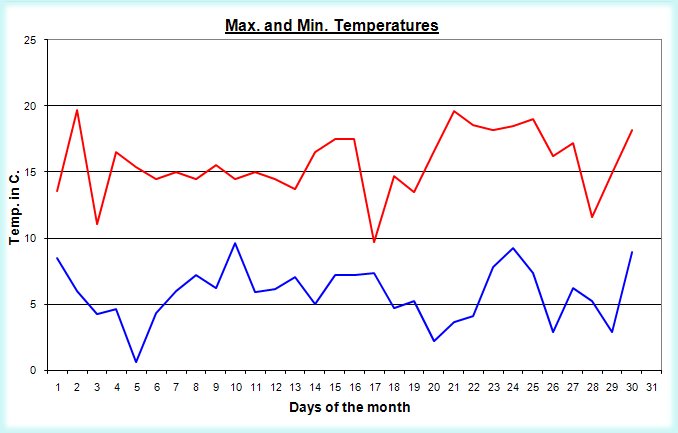
Using a SpreadsheetSpreadsheet programs are super tools for looking more closely to see what the
weather data is telling us. You can set up the program to find
maximums and minimums. They can also create lots of different
sorts of graphs using the data. The graphs can be used to look
at the data to see if the numbers make sense. If there are
any seriously inaccurate numbers they may show up in the graph.
They can also be used to check to make sure that the maximum
is never higher than the minimum by graphing them on the same
graph. Click on the graph on the right to see a larger image. |
|
Weather on the InternetNow that many people have access to the internet and email, it has become more common for people to share weather data and knowledge. This website is an example of how people like to share what they know, and share their data. This also means that when we use the internet we should remember that some data and information may not be as reliable as it should be. The internet also give access to wonderful satellite images which can show all sorts of weather related data. See the link on the right. |
